Flood Risk Assessment Australia (river and surface water flooding) – Insurance Premium
The insurance industry uses high resolution flood maps to price for the risk of flooding.
Most Australian major cities and some major regional centers today are covered by 5-metre resolution flood maps. Other regional areas are generally covered by the 30-metre resolution flood maps.
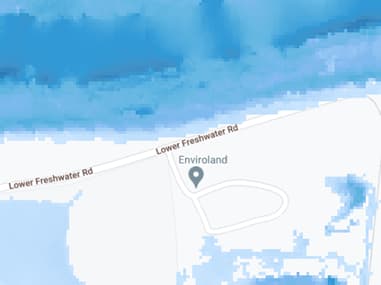
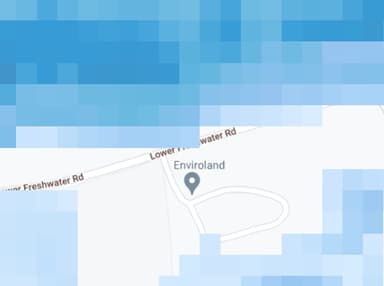
The key difference between the 5-metre and 30-metre resolution flood maps (shown in Appendix 1) is that in the 30-metre resolution, each 30-metre by 30-metre pixel within the flood raster image will provide 1 single value of flood depth. Whereas 5-metre resolution maps will have 36 different readings of flood depth for the same 30-metre x 30-metre area.
5-metre resolution enables a better assessment of risk and damage the flood will potentially cause to each individual property.
That said, an insurer can assess and price for the risk of flood on an individual property basis using 5-metre and 30-metre resolution flood maps. This is illustrated in Appendix 2 with variance in premium depending on the flood risk.
Real life example of insurers pricing for risk of flooding and significant premiums that flood risk attracts can be seen in the following article by Shepparton News.
Flood Risk Assessment (river and surface water flooding) - Property Prices
Given the average property buyer does not have access to adequate information in order to assess the risk of flooding they are often unaware of the flood risk or the level of insurance premium that the property they are purchasing is exposed to when making an offer to purchase. This information asymmetry can have negative consequences in their financial capacity to repay a mortgage and obtain an appropriate insurance cover.
To illustrate the point, 2 properties in the same street, with identical features, one elevated on a hill, and one in a flood zone at the bottom of the hill, will likely attract similar purchase price. Yet the cost to service these properties can vary significantly depending on whether they are or are not exposed to flooding.
In the example shown in Appendix 2 we see that insurance premiums vary by up to ~$5.5k per annum ($165k over the course of a 30-year mortgage, assuming premium variance remains in place over the 30-year home loan period). $5.5k at a 5.5% interest rate can service an additional debt of $100,000 so the property not exposed to flooding within a similar location should theoretically attract a $100k price premium in comparison to the property exposed to a flood. This is not always the case in the property market today.
One alternative to paying higher insurance premiums, is for buyers / homeowners to self-insure the property by excluding flood cover from their insurance policy. Many flood exposed home buyers/ owners choose this pathway to alleviate affordability pressures associated with high flood premiums and the fallout of these decisions are commonly seen in various media articles following a significant flood event where uninsured homeowners are left with large flood damage repair bills.
Caution is offered here as opting out of flood cover is likely a breach of most of the Australian Bank home loan terms and is also not advisable given flood damage can be extensive in terms of cost to repair. Sadly, the decision to opt out of the flood cover for many home buyers / owners is made simply because there is no financial capacity to purchase the flood insurance cover.
Flood Risk Assessment – Bank Lending
Given property buyers seemingly ignore the risk of flooding when it comes to property purchases, how does this impact the Banks that hold a property as security against a mortgage?
Banks at times will have credit policies that either require lower LVR or excess surplus serviceability income for properties identified by a valuer as having high risk of flooding. At times, they might even decline the loan. The process is often complex, inconsistent and has many variables such as valuations not always being obtained or are obtained as a last step before settlement, assumptions that flood damage can be mitigated by lenders or credit managers with limited knowledge of the type of damage property might face, and valuers tend to focus on river flood risk paying less attention to surface water flooding. Often Banks fail to incorporate higher premium required to purchase flood cover into the loan serviceability assessment tools resulting in an overstated capacity for a customer to service a loan.
Home loan terms generally require customers to have adequate insurance in place for duration of the loan, which includes a cover for the risk of flood. Banks do not traditionally check that their customers have adequate insurance in place but rather rely on consumers doing the right thing.
Homeowners as noted above often opt out of flood cover given the high premium cost attached with a view that they are better off putting money saved aside and conducting repairs themselves in instances where they experience flood damage, or they simply cannot afford to purchase the protection needed. Homeowners are often unaware that they are in breach of their loan contract by not having flood insurance cover in place and they tend to underestimate the cost of repair attached to the flood damage.
So where does the risk sit when the homeowner does not have adequate flood insurance cover in place? Under normal economic circumstances where Bank customers are still employed and can fund property repairs either via cash reserves, redraw from their mortgage or through additional financing, the Bank customers will repair the property and the Bank will be unaware of the damage sustained (outside of where customers apply for hardships and loan repayment holidays as a result of the flood). This is the best-case outcome for the Bank.
The worst-case outcome for the Bank would be where the flood event occurs at a time of severe but plausible economic downturn, and the Bank customers have no financial capacity to repay their loan nor cover the cost of repair to their property because of unemployment, reduction in their business revenue etc.
In these circumstances, the Bank would eventually repossess the damaged property and experience a greater loss than if the property was not flood damaged. This is due to:
- the property being flood damaged needing repairs as well as being less marketable due to flooding;
- the Bank must likely fund repairs before it can sell the property, thus extending its holding period of the property; and
- economic downturn is already driving property prices downwards where supply of properties on the market is outstripping demand.
This severe but plausible stress event could result in significant losses for the Bank and has likely not been modelled in prior stress testing exercises conducted.
What capability does Climate Mapping Services have?
Climate Mapping Services can assist small, medium and large Banks with assessment of their flood risk exposures. Firstly we ‘clean' the back book collateral address data using Artificial Intelligence and Natural Language processing algorithms. Second, we assign geo coordinates to each collateral address. We have the capacity to geocode >1 million addresses per week.
Once geo-coordinates are assigned, we can assess flood risk for each individual collateral using our flood maps (we source our flood maps from tier one third party provider).
This will provide the Bank with a granular view of their portfolio's flood risk (depth of water impacting each collateral property) under different probability return periods (1-20, 1-50, 1-100, 1-200, 1-500 and 1-1500 [years]).
Furthermore, we can provide a view of how that flood risk will change for each property as a result of climate change under RCP 4.5 2030, 2050 and 2080 period as well as RCP 8.5 2030, 2050 and 2080 periods.
Finally, we offer our Bank's access to create a secure account with us and obtain live flood reports for each new customer, enabling lenders to discuss flood risks with the customer and thus providing better service – not only to the buyer but also mitigating some of the shortcomings noted above for the Bank. We can provide this service through our live web application or via an API. An example of our flood risk report can be found here
An added bonus for our Bank client's is having a live view of the flood risk that will also enable the Bank to set risk appetite against flood exposed properties, provide an input into its Loss Given Default modelling, as well as enable live reporting of the flood risk.
Appendix 1: Difference Between 5m and 30m flood resolution


Flood premiums quoted by insurer A and B

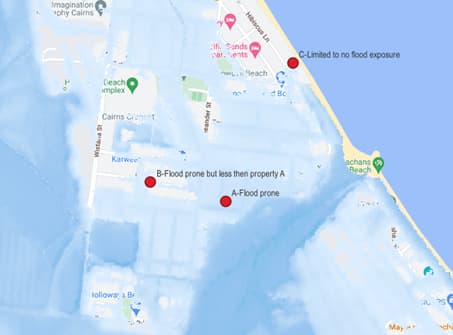
Property A, B and C locations with river flood overlay

Appendix 2: Insurance Flood Premium Example
To obtain the sample insurance premium, we used identical building improvement parameters (3 bedrooms, 2 bathrooms etc). The building sum insured was also kept constant at $600k and the value of contents was constant at $50k with an excess of $1,000 for building and $750 for contents.
Whilst 4 insurers were used to obtain the sample premium quotes only 2 insurers split their flood premium from the overall premium whilst the other 2 did not. With the 2 insurers that did not split their flood premium, similar increases in premiums were observed however we can only speculate that this is due to the flood risk, hence we excluded them from the exercise. Maximum distance between the 3 properties was ~700 meters.
Appendix 3: Property Price Discount Given the Difference in Flood Risk Insurance Premium
The following table shows the discount that property A and property B should attract compared to property C under different interest rates. This is based on the assumption that 3 properties are identical in every way (all are worth $600k before flood is considered) with the only difference being their exposure to flood. The home loan rates are considered on an interest only basis i.e. capacity to repay an interest only home loan is reduced by the additional premium required to obtain flood cover. The $600k price is assumed to be correct for property C which is exposed to very little to no flood risk.


